
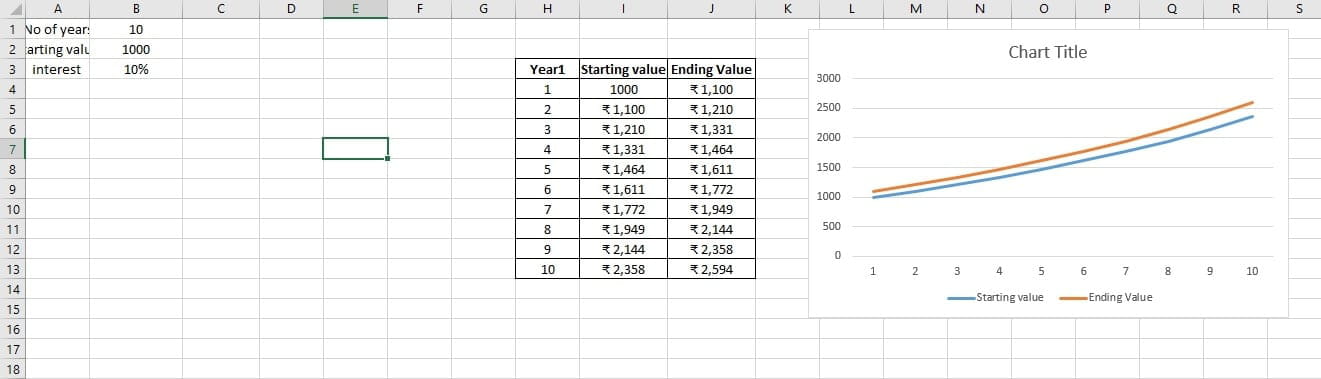
Query on developing table and chart automatically
Closed
machoman4lyf
Posts
4
Registration date
Sunday March 18, 2018
Status
Member
Last seen
April 13, 2018
-
Apr 13, 2018 at 10:47 AM
Blocked Profile - Apr 13, 2018 at 04:21 PM
Blocked Profile - Apr 13, 2018 at 04:21 PM
Related:
- Query on developing table and chart automatically
- Amd crossfire compatibility chart - Guide
- Download automatically while roaming - Guide
- Wbs chart pro - Download - Organisation and teamwork
- Gantt chart - Guide
- How to delete part of a table in word - Guide
