
Creating Graph that updates
Closed
Ryleecone
Posts
7
Registration date
Monday August 12, 2019
Status
Member
Last seen
September 17, 2019
-
Aug 13, 2019 at 02:13 PM
vcoolio Posts 1411 Registration date Thursday July 24, 2014 Status Contributor Last seen September 6, 2024 - Sep 21, 2019 at 09:20 PM
vcoolio Posts 1411 Registration date Thursday July 24, 2014 Status Contributor Last seen September 6, 2024 - Sep 21, 2019 at 09:20 PM

Related:
- Creating Graph that updates
- Gantt graph - Guide
- Psp updates - Guide
- Nvidia check for updates - Guide
- Creating a discord bot - Guide
- Chrome check for updates - Guide
2 responses

vcoolio
Posts
1411
Registration date
Thursday July 24, 2014
Status
Contributor
Last seen
September 6, 2024
262
Aug 14, 2019 at 11:02 PM
Aug 14, 2019 at 11:02 PM
Hello Ryleecone,
Try the following code placed in a standard module and assigned to a button:-
The code uses four helper columns (X:AA) just for an instant in the "Completed" sheet to achieve the desired result.
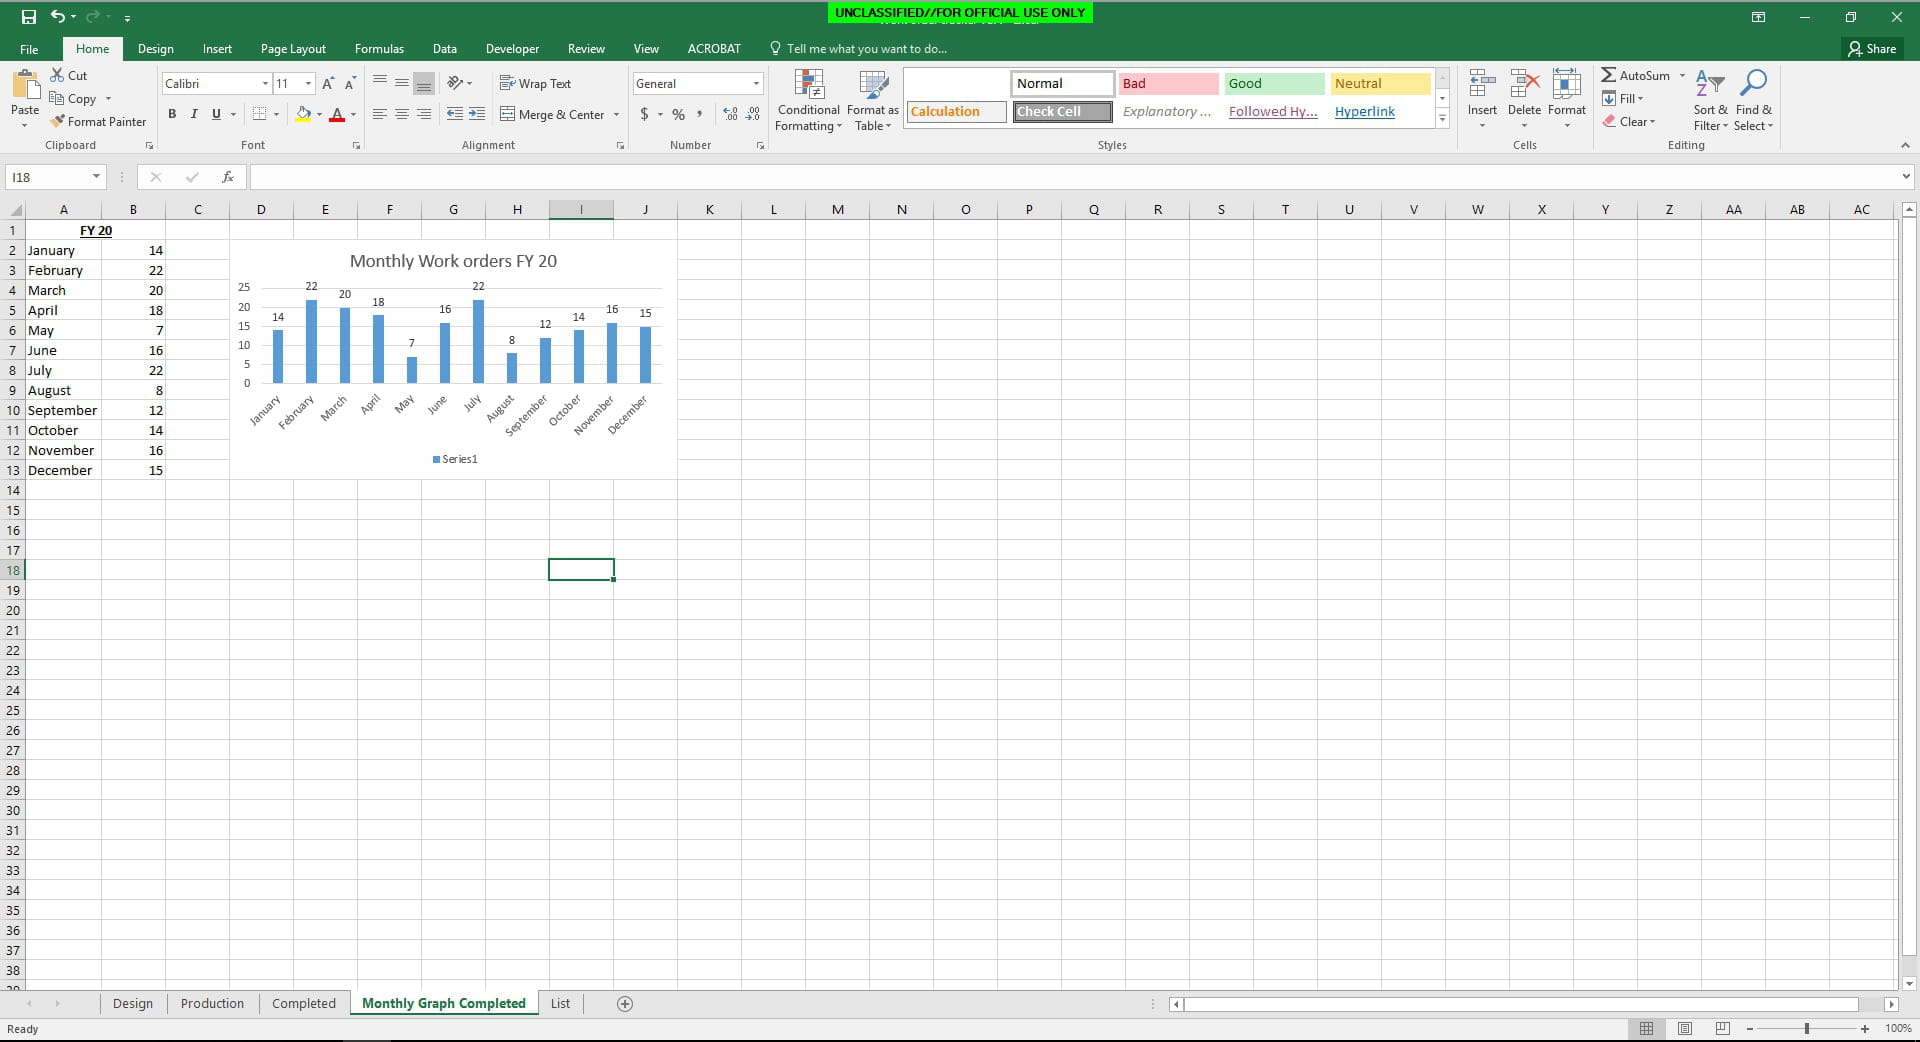
If your graph has been set up correctly, then, each time the code is run, the graph will update based on the new entries in Column B of the Graph sheet.
I've added some comments in the code above (green font) which will help you to understand what's going on.
I hope that this helps.
Cheerio,
vcoolio.
Try the following code placed in a standard module and assigned to a button:-
Sub ValuesToGraph()

        Dim i As Variant, j As Variant
        Dim ws As Worksheet: Set ws = Sheets("Completed")
        Dim ws1 As Worksheet: Set ws1 = Sheets("Monthly Graph Completed")
        Dim lr As Long: lr = ws.Range("A" & Rows.Count).End(xlUp).Row

Application.ScreenUpdating = False

        ws.Range("F2:F" & lr).Copy ws.[X2]   '---->Extract the "Due Date" column(F)over to Column X.
        ws.Range("X2", ws.Range("X" & ws.Rows.Count).End(xlUp)).Sort ws.[X2], 1  '---->Sort in month order (Jan-Dec).
        ws.Range("Y2:Y" & lr) = "=TEXT(X2,""MMMM"")" '---->Extract the month names from Column X to Column Y.
        ws.Range("AA2:AA13") = "=COUNTIF(Y:Y,Z2)"  '---->Counts the number of month entries.

'The following extracts the unique month names into Column Z so that duplicates are not included.
j = Application.Transpose(ws.Range("Y2", ws.Range("Y" & ws.Rows.Count).End(xlUp)))
        With CreateObject("Scripting.Dictionary")
            For Each i In j
               .Item(i) = i
            Next
               ws.Cells(2, 26).Resize(.Count) = Application.Transpose(.Keys) '---->Unique month names are placed in Column Z starting in row2.
        End With

ws1.Range("B2:B13").Value = ws.Range("AA2:AA13").Value '---->The month quantities are placed in Column B of the graph sheet.
ws.Columns("X:AA").Clear '---->The helper columns are cleared.

Application.ScreenUpdating = True

End Sub
The code uses four helper columns (X:AA) just for an instant in the "Completed" sheet to achieve the desired result.
If your graph has been set up correctly, then, each time the code is run, the graph will update based on the new entries in Column B of the Graph sheet.
I've added some comments in the code above (green font) which will help you to understand what's going on.
I hope that this helps.
Cheerio,
vcoolio.
vcoolio
Posts
1411
Registration date
Thursday July 24, 2014
Status
Contributor
Last seen
September 6, 2024
262
Aug 17, 2019 at 10:45 PM
Aug 17, 2019 at 10:45 PM
Hello again Ryleecone,
The following amended code would be a better option as it would account for the months not being in order as well:-
Cheerio,
vcoolio.
The following amended code would be a better option as it would account for the months not being in order as well:-
Sub ValuesToGraph()

        Dim i As Variant, j As Variant, c As Range
        Dim ws As Worksheet: Set ws = Sheets("Completed")
        Dim ws1 As Worksheet: Set ws1 = Sheets("Monthly Graph Completed")
        Dim lr As Long: lr = ws.Range("A" & Rows.Count).End(xlUp).Row

Application.ScreenUpdating = False

        ws.Range("F2:F" & lr).Copy ws.[X2]   '---->Extract the "Due Date" column(F)over to Column X.
        ws.Range("Y2:Y" & lr) = "=TEXT(X2,""MMMM"")" '---->Extract the month names from Column X to Column Y.
        ws.Range("AA2:AA13") = "=COUNTIF(Y:Y,Z2)"  '---->Counts the number of month entries.

'The following extracts the unique month names into Column Z so that duplicates are not included.
j = Application.Transpose(ws.Range("Y2", ws.Range("Y" & ws.Rows.Count).End(xlUp)))
        With CreateObject("Scripting.Dictionary")
            For Each i In j
               .Item(i) = i
            Next
               ws.Cells(2, 26).Resize(.Count) = Application.Transpose(.Keys) '---->Unique month names are placed in Column Z starting in row2.
        End With

'Sending the correct values to B2:B13 of the Graph sheet regardless of the month order in the Completed sheet.
For i = 2 To lr
       For Each c In ws1.Range("A2:A13")
            If c.Value = ws.Cells(i, 26).Value Then
            c.Offset(, 1).Value = ws.Cells(i, 27).Value
            End If
       Next c
Next i

ws.Columns("X:AA").Clear '---->The helper columns are cleared.

Application.ScreenUpdating = True

End Sub
Cheerio,
vcoolio.
Ryleecone
Posts
7
Registration date
Monday August 12, 2019
Status
Member
Last seen
September 17, 2019
Sep 17, 2019 at 09:18 AM
Sep 17, 2019 at 09:18 AM
I don't think this one works, it counts everything as 0.
vcoolio
Posts
1411
Registration date
Thursday July 24, 2014
Status
Contributor
Last seen
September 6, 2024
262
Sep 21, 2019 at 09:20 PM
Sep 21, 2019 at 09:20 PM
Hello Ryleecone,
I've just created a sample of what I assume would be similar to your workbook based on the images that you supplied and the code does exactly what it is supposed to do in this sample.
If you are still having problems then please supply a sample of your workbook so that we can do some testing with it. To supply a sample, upload a replica of your workbook to a free file sharing site such as ge.tt or Drop Box then post the link to your file back here. Make sure that the sample is an exact replica of your actual workbook. If any of your data is sensitive then please use dummy data.
Cheerio,
vcoolio.

Sep 17, 2019 at 08:41 AM
Thank you,
Rylee
Sep 17, 2019 at 09:38 AM