
Microsoft Word charts: create, insert, customize


Microsoft Word offers several graphing tools such as pie charts, scatter graphs, and stock charts to help users create infographics and data visualizations. This guide will run you through the steps for creating custom charts in Microsoft Word.
How to insert charts into a Microsoft Word document?
- Open your Word document and click on the Insert > Illustrations > Charts.
- Word will open a menu titled Insert Chart.
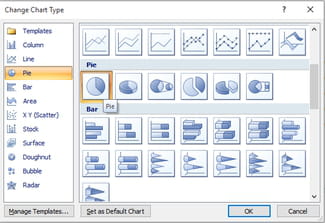
- Select the type of chart you'd like to create and then choose the desired template:
- Click on OK to insert the selected chart into the document. By default, the chart will insert at your current cursor position.
- Word will also create a data sheet (Excel table) for the chart. Any modifications made to the data sheet will be automatically carried over to the new chart.
How to customize your Microsoft Word chart?
- Open your Word document, select the desired chart and then go to Chart Tools > Design tab. Here, you will be able to edit the chart to your liking.
N.B. You'll find additional customization options under the Layout and Format tabs.
Do you need more help with word? Check out our forum!
Subject
Replies